Executive KPI dashboards
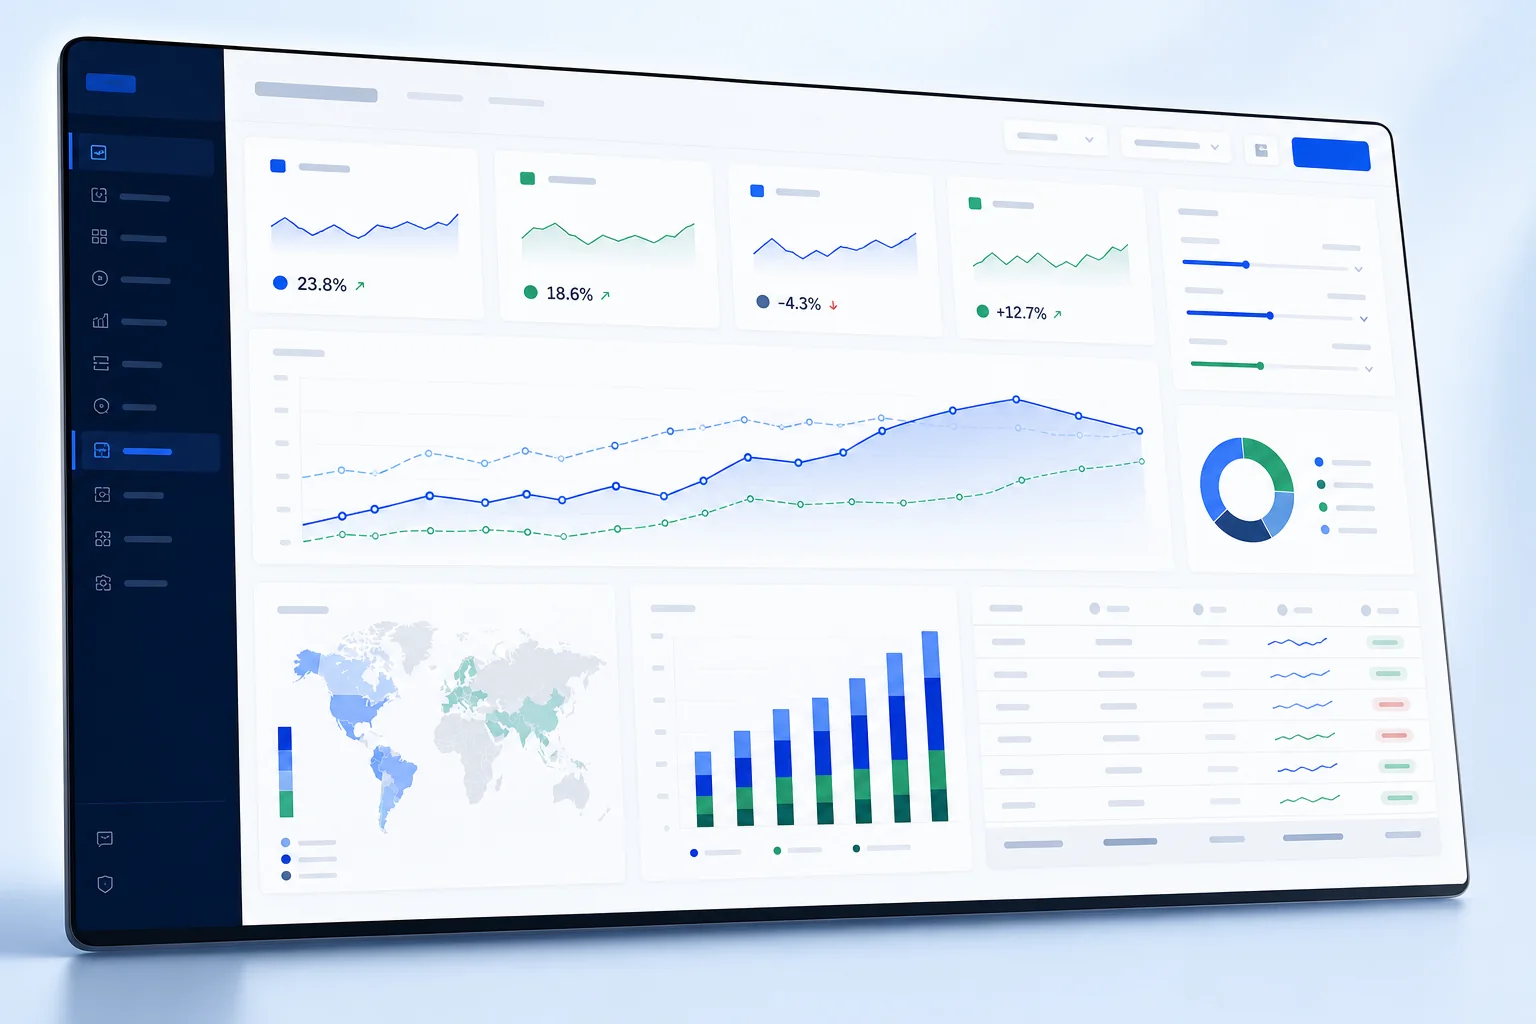
One screen, the metrics that drive a decision, and a target for each one so a number means something.
Excel experts for hire
Find an Excel expert to turn a sprawling workbook into a dashboard someone will actually use to make a decision.
 Abhishek
 Abhishek Singh
 Akhilesh
 Prahalad
 Shakti
A remote team of Excel and spreadsheet specialists. You work directly with the person building your file, from the first question to the final handover. More about us.
The short version
Most dashboards fail for the same reason: they were designed around the data that happened to be available rather than the decision the reader has to make. We start from the other end. Who opens this, how often, and what will they do differently because of it? Everything else follows from that answer.
Scope
Every engagement gets an hours estimate before it starts. If something below is not relevant to you, it comes out of the scope and off the estimate.
One screen, the metrics that drive a decision, and a target for each one so a number means something.
The detail view for the person doing the work, connected to the same source as the summary so they never disagree.
Paste or import new data, refresh, done. No rebuilding the layout each cycle.
Slicers, dynamic ranges and scenario toggles that stay fast on real data volumes.
Need to check a feature before hiring? Read Microsoft’s official Excel help and learning for formulas, PivotTables, importing data and troubleshooting.
Same work, different job titles
These all describe the same engagement. The title matters less than whether the person writes things down — but it is worth knowing which term to search, because the results differ.
The build side: someone who turns agreed metrics into a screen that refreshes without being rebuilt each month.
Used where the output is a recurring report pack rather than a single interactive screen. Often the more accurate description.
Emphasises layout and legibility. Worth saying plainly: design matters far less than whether the numbers underneath are agreed.
Where the work is BI in substance but Excel in tooling, which is a legitimate and often correct choice.
Method
We ask what changes based on this dashboard. If nothing does, we say so before building it.
Each metric gets a written definition. This is where most of the disagreement lives, and it is cheaper to resolve now.
A working version with your real data, early enough that changing your mind is free.
Documentation, an update procedure, and a walkthrough recording so the file outlives the handover call.
| Discovery | 15% of hours | Understanding the decision the file supports, and who edits it. |
|---|---|---|
| Prototype | 20% of hours | A working version on your real data, while changing course is still cheap. |
| Build | 40% of hours | The main work, against definitions agreed in writing first. |
| Testing | 15% of hours | Edge cases, checks that fail loudly, and the numbers reconciled. |
| Handover | 10% of hours | Documentation, update procedure and a recorded walkthrough. |
Questions
What clients ask before commissioning this work.
Ask us something elseDashboards are usually 10–20 hours on clean data, billed hourly. The variable is how much data preparation sits underneath — that stage gets its own estimate so you can see what you are paying for.
A focused dashboard on clean data is usually 10–20 hours. If the underlying data needs cleaning or reconciling first, that stage is estimated separately so you can see what you are paying for.
Yes, and it is usually the better starting point. Your existing workbook encodes a lot of knowledge about how the business actually works.
Excel when a human needs to change assumptions and see the effect, or when the audience will not adopt another tool. Power BI when the data volume is large and the reporting is standardised. We will recommend against Excel when it is genuinely wrong for the job.
Often combined with
Most engagements touch more than one of these. We scope them together rather than selling them separately.
Start with the problem
Send the file or describe the problem. An hours estimate back within a day, at no cost.
Post your projectA short introduction
A short introduction to our Excel and spreadsheet work.
The short introductory video shows spreadsheet tables and dashboards, a person working on a laptop, and a message inviting viewers to post their project.